Debug Quickly and in Context with Truffle Teams New Debugger

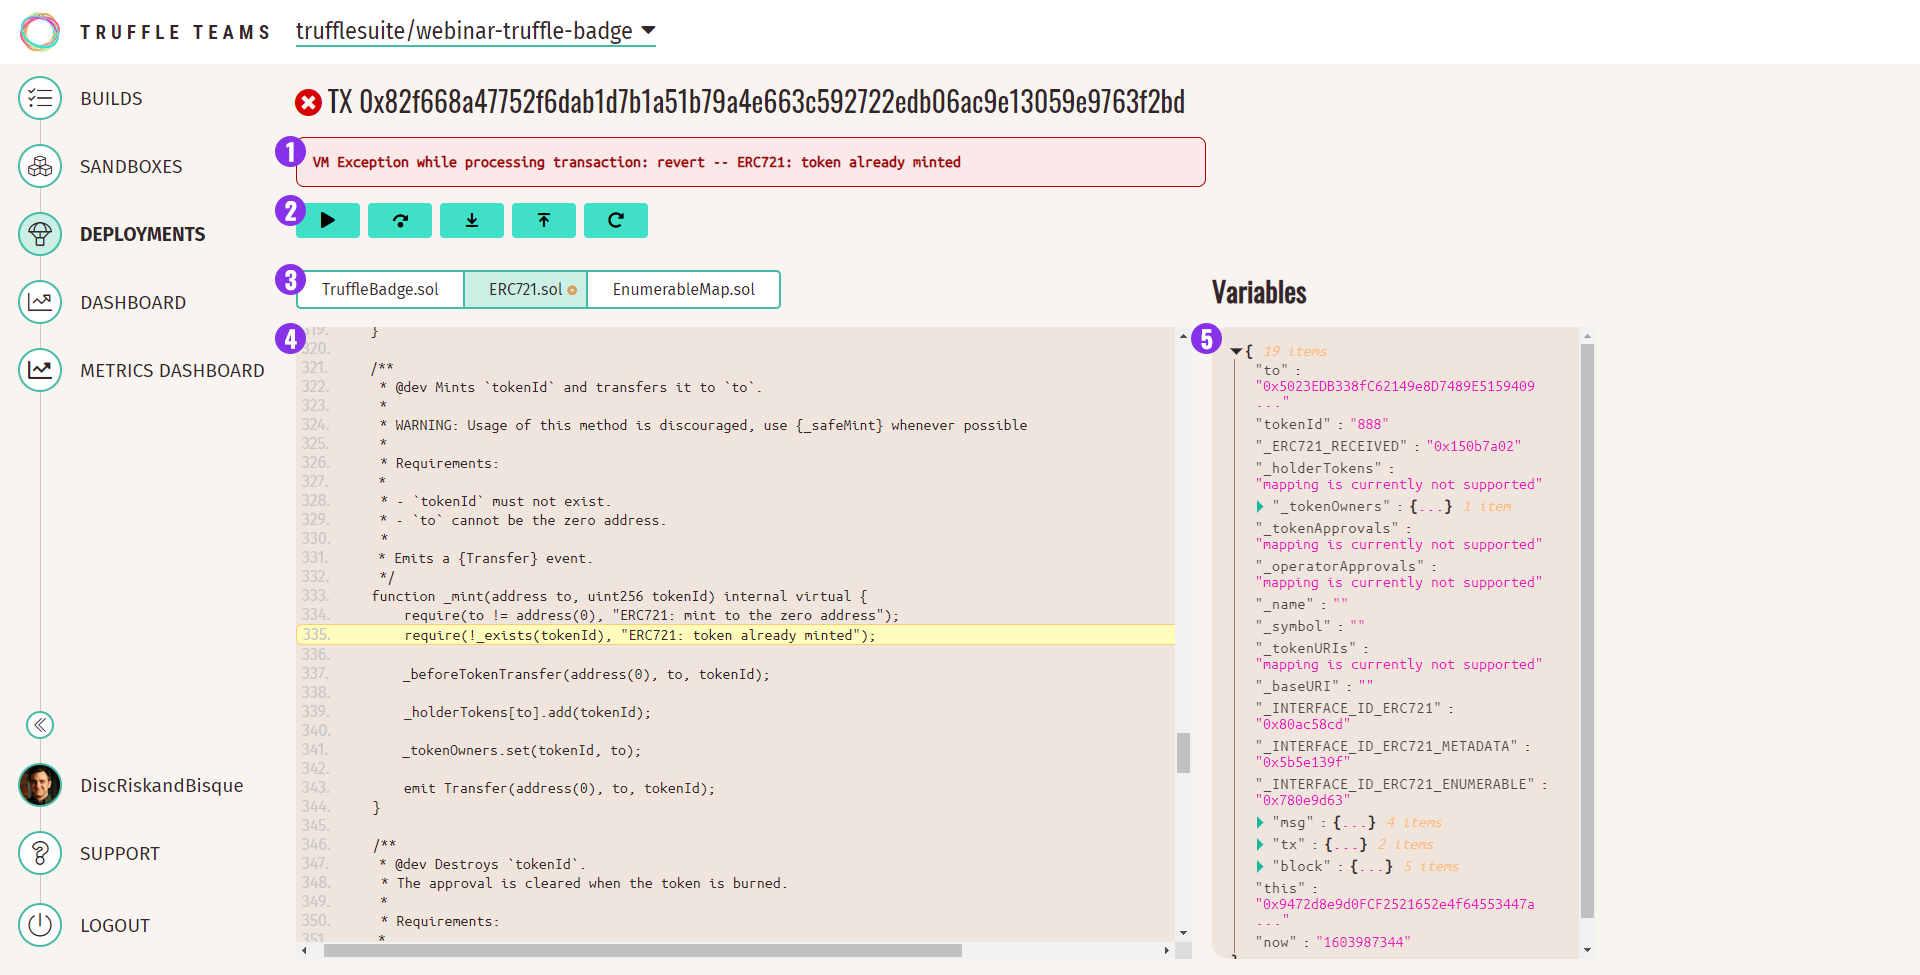
If you've used Truffle's debugger, you know it's best-in-class. Until now though, it's been confined to the command line. Today the debugger breaks out of the console to a GUI within Truffle Teams! This is a huge workflow enhancement--allowing us to debug transactions in the places we're already viewing--via the deployment details screen or while monitoring individual contracts. Let's take a look!
Note: To use the debugger right away, you'll need to opt-in to Truffle Teams Early Access.
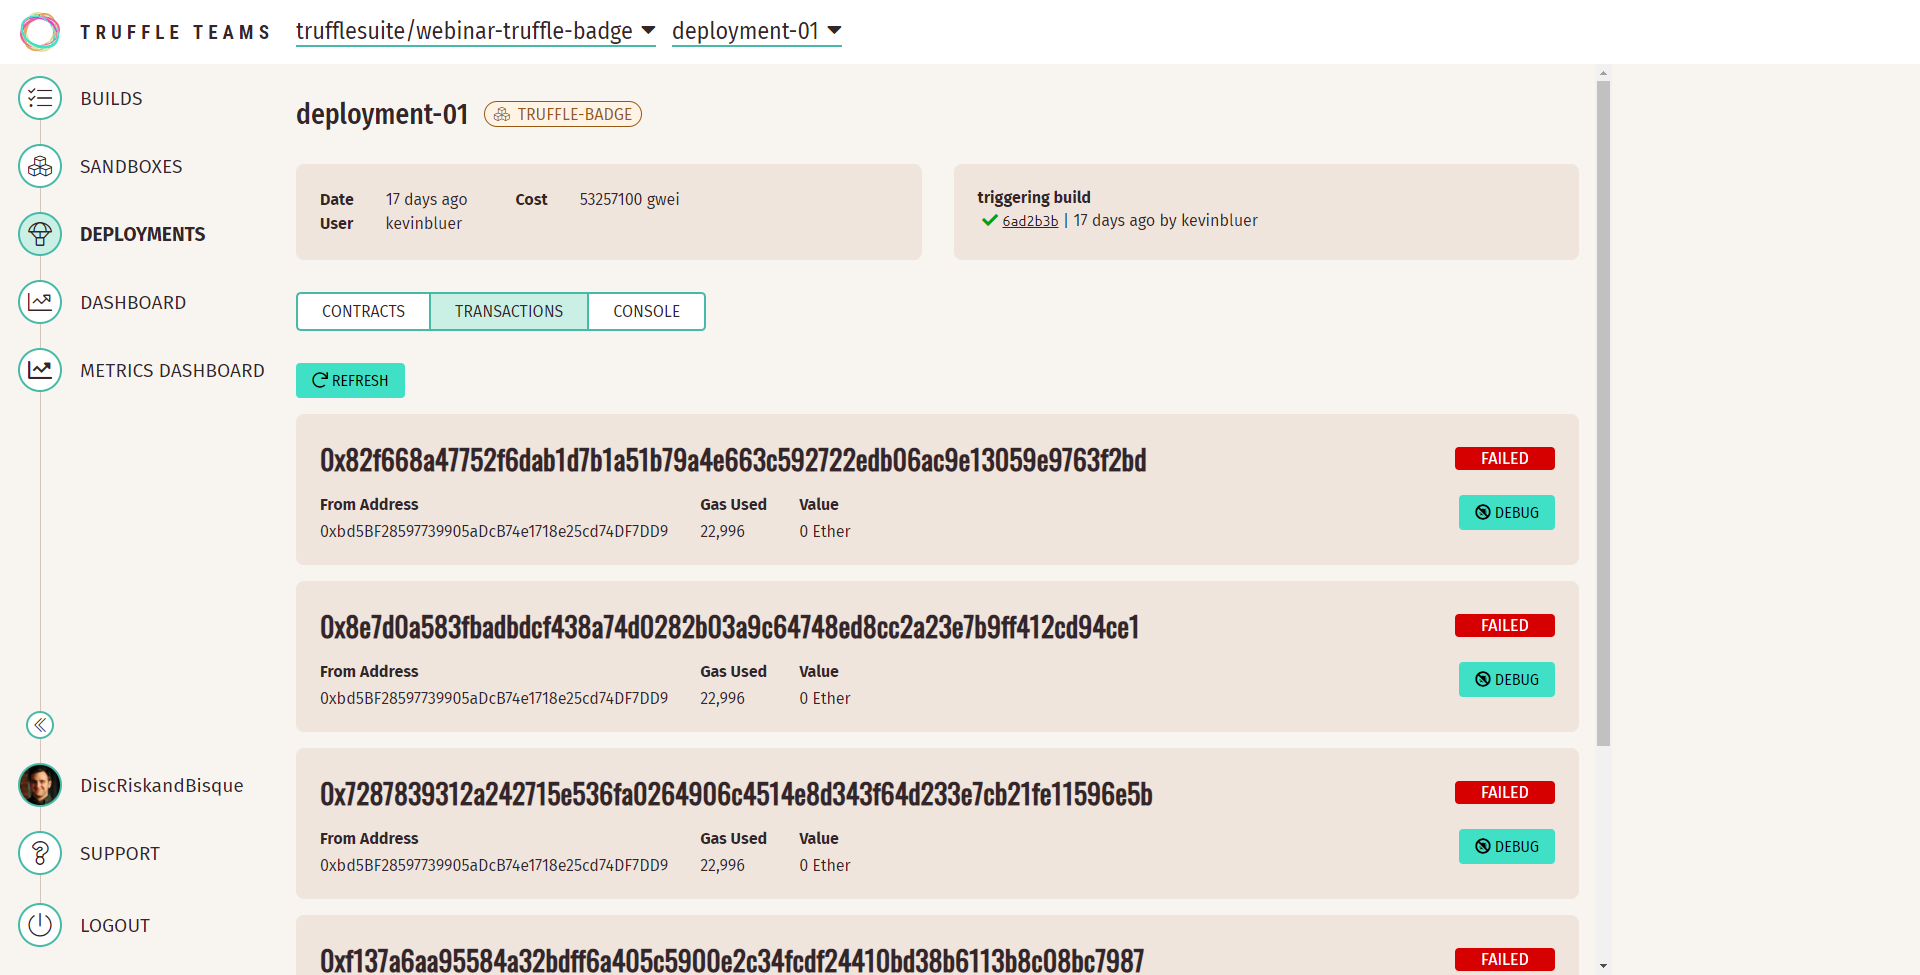
Launching the Debugger
To launch the debugger, we just need to find a transaction. Head over to the Deployments screen and select a deployment. From there select the transactions tab or click the monitoring button for a contract. You'll notice there's a debug button on each transaction card; clicking it will open the Truffle Teams debugger.

